Foundation of Data Analytics for College Students

Experienced and qualified faculty

Experienced Faculty

Classroom sessions conducted by IIT, IIM alumni with 40 years of industry experience

Focus on concepts with practicals

Key Concepts

Learn powerful data understanding, analyzing and reporting using data visualization tool – Tableau

Instructor led classroom sessions

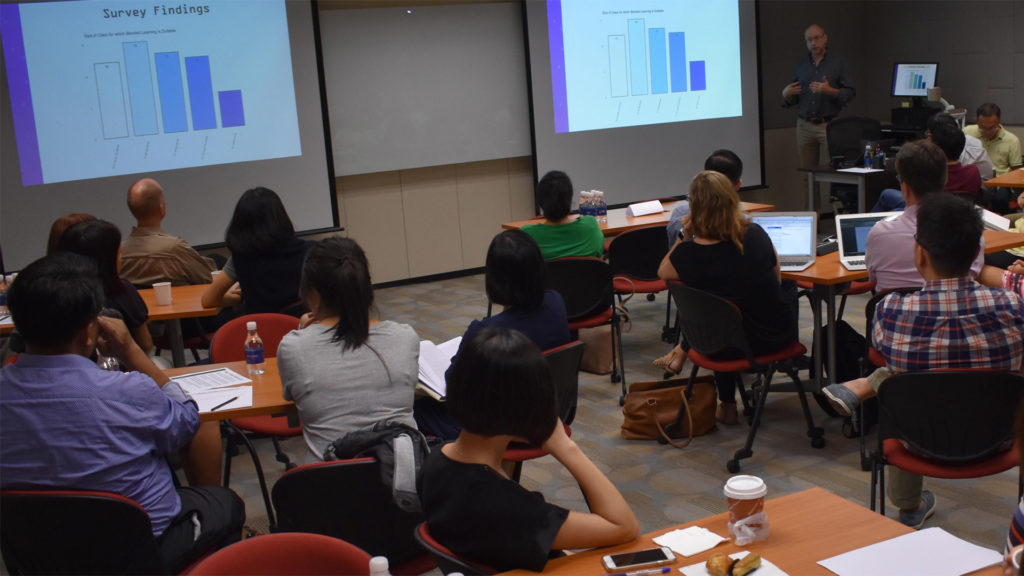
25+ hour of instructor-led classroom sessions. Additional 25+ hours for projects and assignments

Comprehensive Course Coverage

Career Counseling

Wide course coverage that includes Tableau software, functions and statistics, and business insights.

Upcoming Batches

Who should attend this course?

Candidates from various quantitative backgrounds, like Engineering, Finance, Maths, Statistics, Business Management who wants to head start their career in analytics & data science. This program is designed for college students only where they learn more on data understanding before coming on the advance program on big data/Analytics.

Requirements and Benefits

To understand this course, it is advisable to have a foundation level of knowledge of the basic level of excel and data number understanding. Data Analytics & Visualization is needed to be every industry for business insight. This is a power-packed analytics training for beginners who wants to clear interviews and target job profiles related to Data Analytics and Reporting and Excel or Tableau based MIS/BI Analyst profiles. In this program, candidates will also learn Tableau, one of the most popular data visualization.

What is a data engineer or data analyst

While data scientists and data analysts perform some of the more visible aspects of data mining and insight gathering, the data engineer forms the foundation of the process. At the risk of oversimplifying, data engineers/Analyst develop and build the infrastructure that collects the data to be analyzed by data scientists and analysts. At their foundation, they are software engineers, designing and maintaining systems that can collect and integrate data from various disparate sources and create data sets that can be massaged into meaningful insights.Data engineers come from a background in engineering, CSE/ECE/ME, or Management graduate, with knowledge in both database development and management and engineering practices.Among the skills in high demand include database administration (in particular data cleaning, and ensuring accurate data sets)

Why data scientists roles are so important?

Data science is repeatedly referred to as one of the most important and critical industries of the future. In fact, the Harvard Business Review once called data science the “sexiest job of the 21t century.” However, often these statements refer to data analysis, or the actual process of gleaning actionable, valuable insights from data. We hear about retailers analyzing customer buying patterns to determine whether they may be getting married or having a baby, and are amazed and/or shocked at how much they really know about us — and we’re amazed that we receive coupons for diapers when we haven’t even told anyone that we’re pregnant yet. Without data engineers, most of this analysis would be difficult or even impossible. There is simply too much data being created for the old methods to remain relevant. Data engineering is a fundamental part of the new world of big data, not only increasing the amount of data collected, but also ensuring that is clean, consistent, and high quality. It’s not always a visible part of the data science process — and undoubtedly can be frustrating — but without it, businesses would never be able to keep up with the influx of data or obtain reliable results from their analysis.

What you will learn?

Key concepts of Tableau software, functions and statistics, and business insights. You will get an opportunity to work on 2 projects.

Introduction

  • Working with Formula and Functions
  • Creating Charts and Graphics
  • Logical functions using Excel
  • Analyzing Data with Excel
  • Statistical and Mathematical Functions
  • Power Map & Demographic visualization
  • Range
  • Formulas and Functions
  • Ribbon
  • Workbook and Worksheets
  • Format Cells
  • Find & Select
  • Print
  • Share and Protect
  • Templates
  • Data Validation
  • Keyboard Shortcuts
  • Count and Sum
  • Logical
  • Round
  • Text
  • Lookup & Reference
  • Formula Errors
  • Array Formulas
  • Cell References
  • Date & Time
  • Financial
  • Statistical
  • Sort
  • Filter
  • Conditional Formatting
  • Charts
  • Pivot Tables
  • Tables
  • What-If Analysis
  • Data Tables
  • Goal Seek

Equations

  • Quadratic Equation
  • Transportation Problem
  • Assignment Problem
  • Shortest Path Problem
  • Maximum Flow Problem
  • Capital Investment
  • Sensitivity Analysis
  • Histogram
  • Descriptive Statistics
  • Correlation
  • Regression
  • Moving Average
  • Exponential Smoothing

Overview of Data Reporting & Dashboard

  • Deciding on Dashboards
  • Charting(Pivot Charts & Normal Charts)
  • Advanced Power Charting Techniques
  • Adding ActiveX controls
  • Trends & Scenarios.
  • Creating your Excel Dashboards
  • Bullet-Proofing your Dashboards
  • Practical Dashboard Creation

Overview of Tableau & visualization

  • Building Basic Reports
  • Building Advanced
  • Reports/Maps
  • Formatting
  • Working with Data
  • Statistical and Mathematical Functions
  • Power Map & Demographic visualization

Key Learning Areas

The learning areas include hands on expertise in Python programming and its libraries, statistical analysis of data, and concepts of linear algebra. The program focuses on building expertise in  data analysis concepts. Even if you do not have any expertise in Python programming and data analysis, you will learn faster from our classes.

Python
Learn concepts of Python programming language
Statistics
Concepts of probability, probability distributions
Linear Algebra
Working with linear equations, vectors, and matrices

Join the training program

Learn the latest technology and be part of a revolution. 

Training Program Fee Rs 7000+ GST

Registration Fee Rs 500

Watch our live training sessions to know
more about our training pedagogy

Our Office Locations

Head Office - Gurgaon
Samatrix Consulting Pvt Ltd
311 Vipul Trade Centre
Sector 48, Sohna Road
Gurgaon - 122018
India
New Delhi
NDIIT
105. Nehru Pl Road,
Block 1, Kalkaji
New Delhi – India
110019
Bengaluru
166, Second Floor,
5th Main Road, MC Layout,
Opp BDA Complex,
Vijayanagar,
Bengaluru
Karnataka – India
Bijnor
Samatrix Consulting Pvt Ltd
1st Floor,
Near Shakthi Chowk,
Civil Lines
Bijnor – Uttar Pradesh – India
Previous
Next

Don’t Be A Stranger…

Just write down some details and our customer success heroes will get back to you in a jiffy!

Contact Info

Welcome

WE WANT TO HEAR FROM YOU